
If you are running Microceph, can you run the Ceph Dashboard as you can in full-blown Ceph? Yes you can! The process to spin this up is fairly straightforward with a few commands to run that will allow you to spin up the solution to monitor your Microceph storage. Let’s look at Microceph Ceph Dashboard install and configuration.
What is Microceph?
Just briefly, Microceph is an easier way to install Ceph storage. It abstracts much of the configuration into simpler commands you can run on your Linux hosts. It is a great solution for running HCI storage for a microk8s Kubernetes cluster and I am doing this in the home lab and it has been working great for both a Docker Swarm cluster and Kubernetes as well.
What is the Ceph dashboard?
The Ceph dashboard is a module included with Ceph that provides a web interface for your Ceph environment to be able to login and see a dashboard GUI of your Ceph storage environment. When you login, it will show you an overview of your storage, any errors on the system, and you can also perform certain tasks, like enabling modules, etc.
Ceph dashboard install
The commands to install the Ceph dashboard are not too difficult for Microk8s. Just run the following commands:
##Set the configuration to not use SSL - this seems to be broken with Python dependencies at the moment to use SSL in my testing, but working on this
microceph.ceph config set mgr mgr/dashboard/ssl false

##Enable the dashboard with the command below
microceph.ceph mgr module enable dashboard

##Set your initial admin password for microceph dashboard
echo -n "password" > /var/snap/microceph/current/conf/password.txt

##Create the initial admin account with the password set above
microceph.ceph dashboard ac-user-create -i /etc/ceph/password.txt admin administrator

##Remove the password file
rm /var/snap/microceph/current/conf/password.txt
Let’s now take a look at what the Ceph dashboard looks like.
Looking at the Ceph Dashboard
When you enable the Ceph Dashboard, you will be able to browse to the web port on your Ceph cluster host, port 8080 for non-SSL, and port 8443 for SSL. Login with your password you set in the command examples above.
You will see the following dashboard readout, which gives a great overview of the cluster in general and the ability to quickly click around and view various objects and configurations as part of the Ceph cluster.
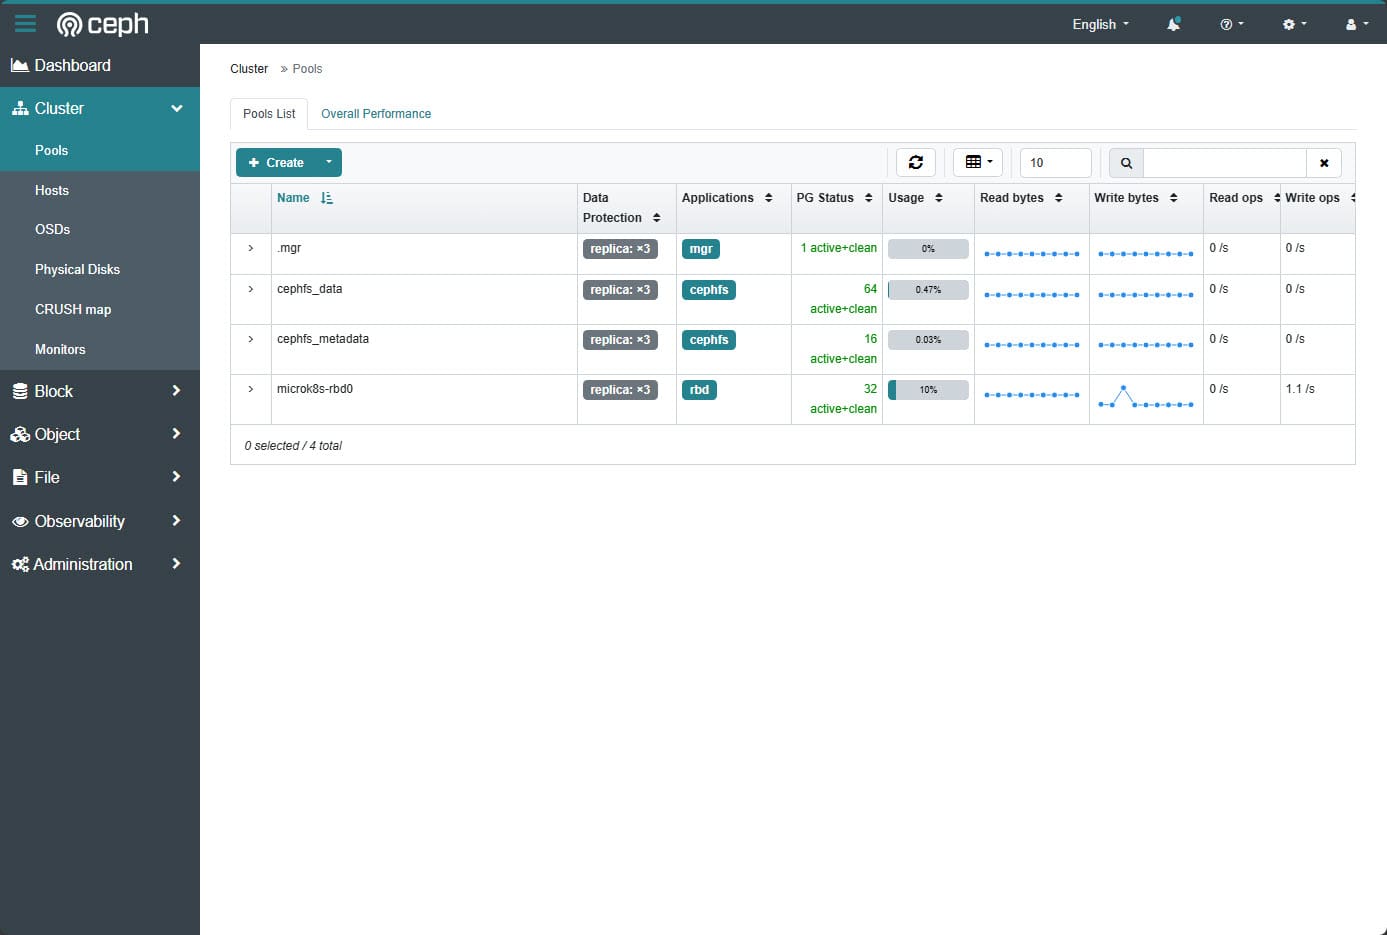
Below, I have clicked the Cluster > Pools menu item. We can see the cluster pools and also have the ability to create a new pool with the green create button.
On the hosts menu itme, we can view our hosts, and what service instances they are running as well as the status for the hosts.

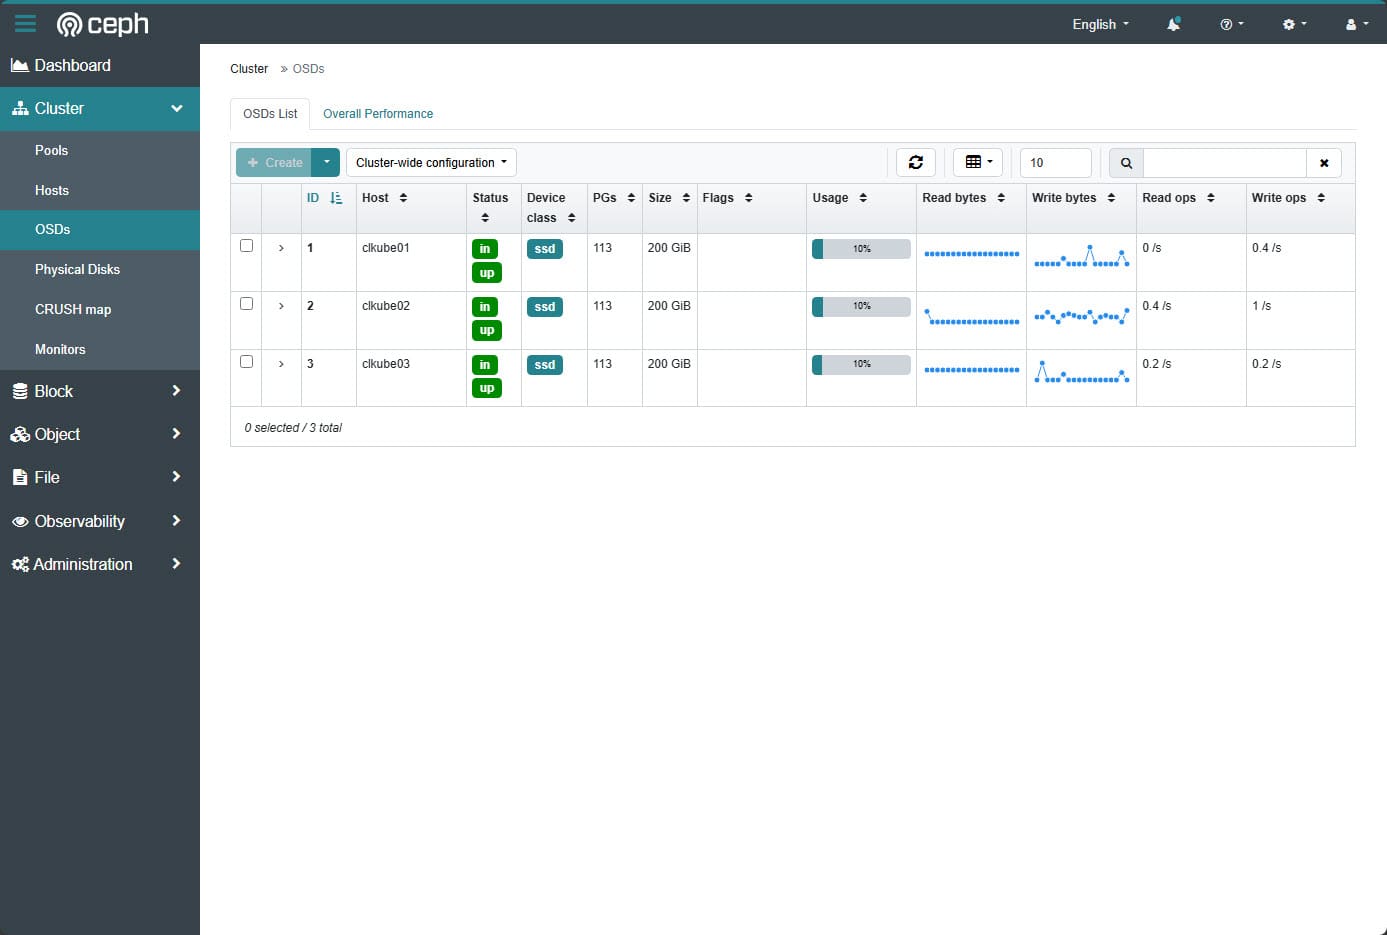
On the OSDs screen, you can see the Ceph OSDs, the PGs, the size of the OSDs, usage, ;read bytes, write bytes, read ops, and write ops.
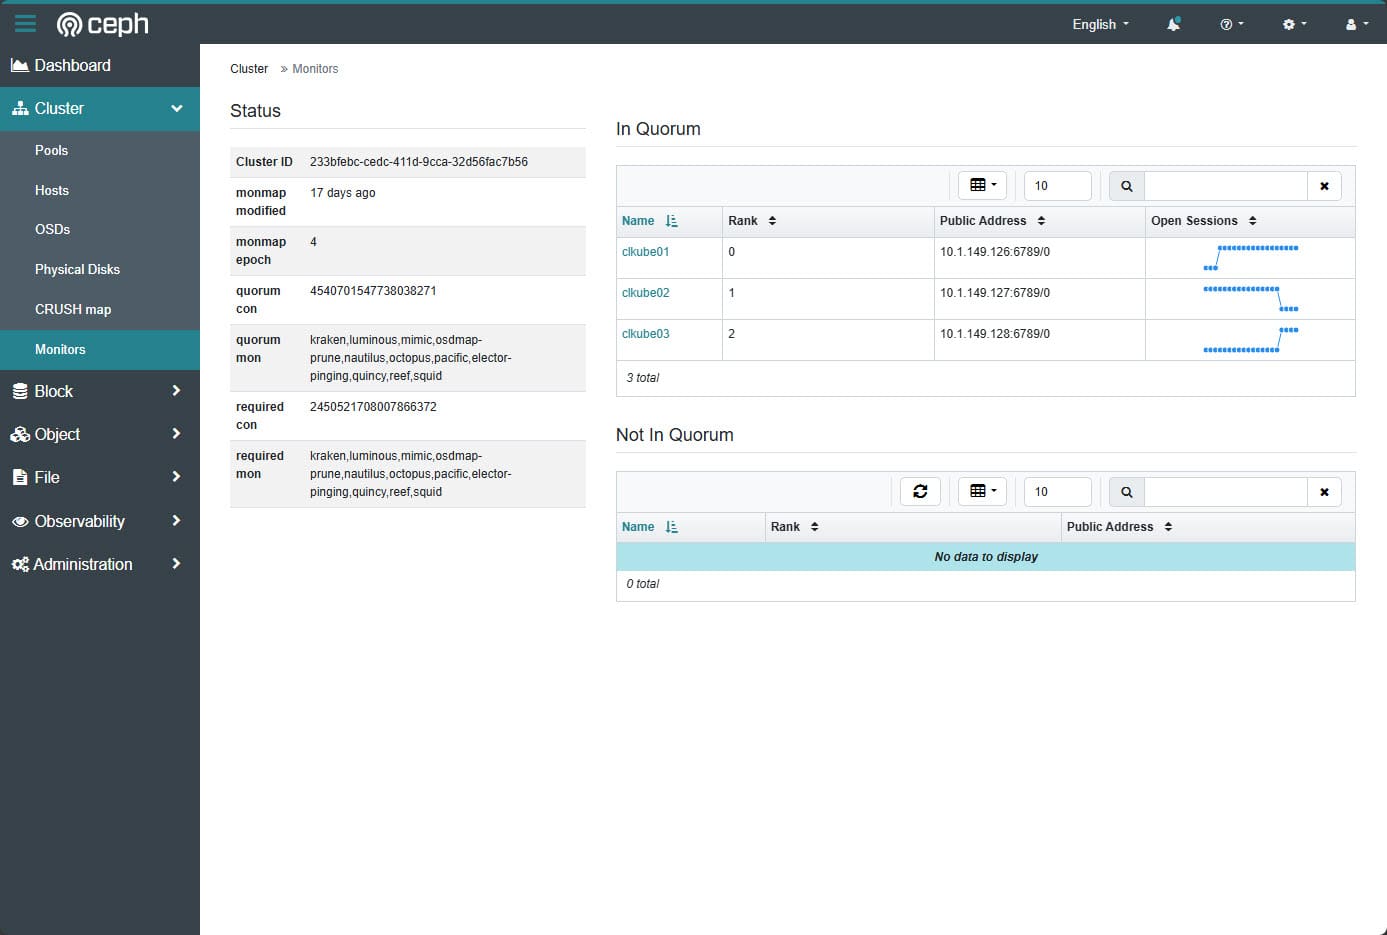
The Ceph monitors screen shows the status of your Ceph monitors. You can see also if they are in quorum.
Also, what is really nice is you can see your CSI block objects. Below, you can see the CSI objects which are block objects for Kubernetes pods running persistent volume claims in the cluster. These are provisioned using the rook-ceph integration with Microk8s.
Also, for those who want to make use of CephFS, you can use the File menu > File systems to display the file systems configured.
Like the block objects, you can view CephFS file objects as well. Here you can see CSI persistent volume mounts from pods in the cluster. This is great as it gives you the name of the CSI volume, which pool it is located in, the usage, path, mode, and when it was created.
Also handy is the Observability menu with logs. You can view your Ceph logs from this screen. Also, it makes working with your logs extremely easy as you have the ability to search for keywords, set a date or even a time range along with filtering based on the alert priority.
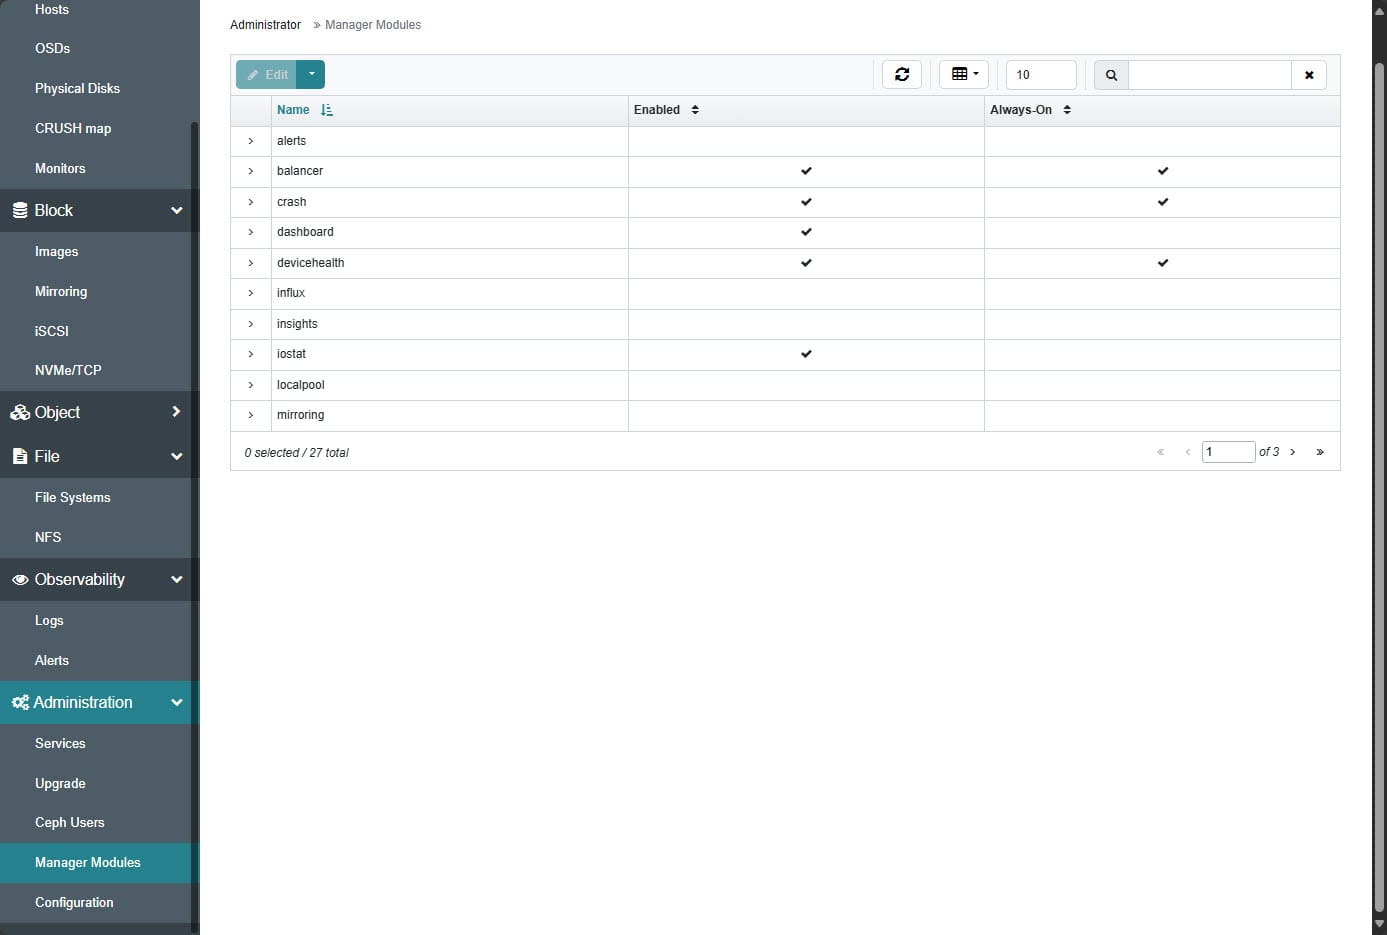
Also, we can view our manager modules. You can see which ones you have enabled for Ceph and from this screen, you can edit and enable or disable modules from the Ceph dashboard.
Wrapping up
If you are running Ceph for your Kubernetes cluster, Docker Swarm cluster, or just general file storage, having the Ceph dashboard running is a great tool to having visibility on the health of your Ceph storage and even the tools for configuring things. I did have trouble with enabling the Microceph dashboard with SSL in Ubuntu 22.04 and 24.04, regarding Python dependencies and versions that are used by Microceph. Let me know if you guys have run into this or maybe have a workaround.


0 Comments